For a more in-depth data analysis example, see our guide on building a data analyst AI agent with LangGraph, Browserbase, and Riza.
Scenario: Understand different datasets quickly
Many government websites provide public datasets. For example, the city of San Francisco provides the annual salary of each city employee. These datasets have different data models, and it can be time-consuming to manually analyze each dataset. If we want to understand trends much more quickly, we can use LLMs to generate code to analyze a given dataset for us.Solution: Automatically compute stats and plot charts
We’ll build a script that automatically computes statistics and plots a chart for a given dataset. In this script, we’ll prompt an LLM to generate code to produce a chart, and we’ll safely execute that code using Riza.Example code and data
Get the full code and data for this example in our GitHub. The data we’ve prepared is a subset of the full San Francisco employee salary data. This subset is anonymized and includes only individuals working in Fire Services. Here’s an example chart generated by our script: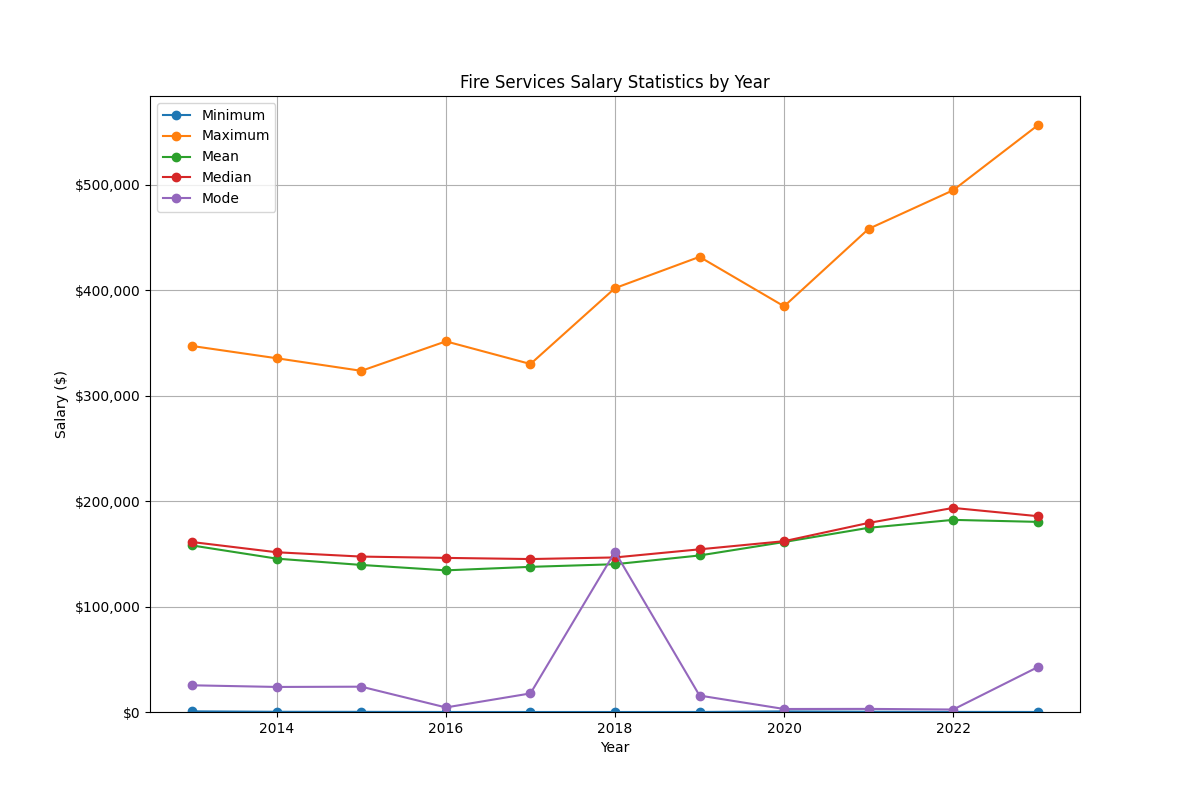
Step 1: Read in data from CSV
First, we’ll read in the data from our CSV.Step 2: Generate data analysis code with LLM
In this step, we’ll pass a few lines of the CSV we just read to Anthropic, and ask it to generate custom code to calculate some statistics and produce a chart. First, install and initialize the Anthropic SDK:generate_code() function, along with a prompt for the LLM:
generate_code(csv_sample) in main(). We’ll only send a few rows of our CSV data to the LLM, because that’s all it needs to understand the shape of the data:
Key components of the prompt
Note that in our prompt above, we explicitly ask the LLM to do a few things:- Write Python code. We plan to execute this code in a Python runtime on Riza.
- Write a function that reads data from an object and returns an object. We plan to use Riza’s Execute Function API to run this code. The Execute Function API lets us pass in an input object and receive an output object.
- Use the Python standard library, plus
pandas,matplotlib, andseaborn. We’re asking the LLM to write code to analyze and visualize data, so we want it to be able to use these popular libraries. By default, Riza provides access to standard libraries. To use additional libraries, you can create a custom runtime. We’ll do that in the next step.
Step 3: Execute the code on Riza
Now that we have LLM-generated code, we’re ready to run it on Riza and finish our script.Step 3a. Create custom runtime
As we mentioned above, we allowed the LLM to usepandas, matplotlib, and seaborn in its parsing code. To make these libraries available on Riza, we’ll create a custom runtime.
Follow these steps:
- In the Riza dashboard, select Custom Runtimes.
- Click Create runtime.
- In the runtime creation form, provide the following values:
- Click Create runtime.
- Wait for the Status of your runtime revision to become “Succeeded”.
- Copy the ID of your runtime revision (not the runtime) to use in the next step.
Step 3b. Call the Riza API
Now, let’s add the final pieces of code to finish our script. First, install and initialize the Riza API client library:run_code(), that calls the Riza Execute Function API and uses our custom runtime.
Make sure to fill in your own runtime ID:
main() function to run the generated code, and save the resulting image:
Next steps
- Get the full code for this example in our GitHub.
- Try out the API.
- Learn how to use the Riza API with tool use APIs from OpenAI, Anthropic and Google.
- Check out the roadmap to see what we’re working on next.