- LangGraph to orchestrate the agent
- Browserbase to scrape the website
- An LLM to write code to extract and transform the data from the website, and to write to code to create a data visualization
- Riza to safely execute the LLM-written code
Video overview
Like video? Here’s an optional overview of the AI agent. We’ll dive into the full details below.Scenario: Analyze price changes & produce report with chart
In this demo, we’ll build an agent that monitors changes in gas prices in different states across the U.S, and generates a report. There are a few challenges in our scenario:- The data updates regularly and is time-consuming to analyze by hand.
- The data we want lives on a website that does not have an API.
- The design of the website may change at any time, without warning. These design changes may break code we write to extract data.
- We want to compare new data against previous data, highlight notable changes, and generate an appropriate chart that goes along with the dynamic analysis. That means we don’t know what kind of chart we want to create each time we generate the report.
Solution: Data analyst AI agent
To solve these challenges, we’ll build an AI agent that can:- Navigate to the website and extract the HTML.
- Extract and tranform the data in the HTML into a CSV.
- Detect changes in the data.
- Perform data analysis only if there are changes, producing a written summary and a visual chart.
Example code and data
Get the full code and data for this example in our GitHub. Here’s an example analysis and chart generated by the agent: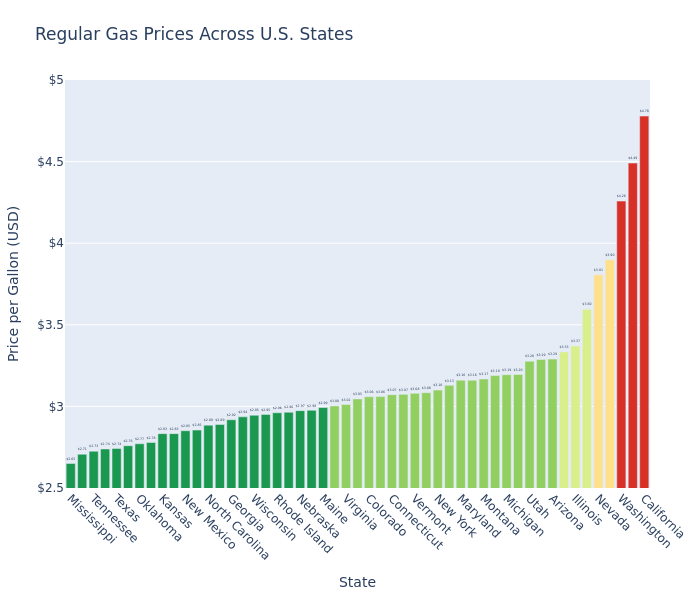
Prerequisites
Before we start, you’ll need:- An Anthropic account and API key
- A Browserbase account and API key
- A Riza account and API key.
You can adapt this guide to use another LLM provider. There is no special reason we chose Anthropic for this use case.
Step 1: Set environment variables & install dependencies
In your project root, create a.env file with the following variables:
.env
- Run
uv init - Run
uv add browserbase langchain langchain-anthropic langgraph playwright python-dotenv rizaio
Step 2: Define AI agent state
Let’s first create a class that will hold the state used throughout our LangGraph workflow. Create astate.py file that defines a TrackerState class:
state.py
url to scrape; and storage_folder_path, the local folder where we want to store our scraped data and saved charts. The other fields will be populated by the steps in the workflow.
Step 3: Define LangGraph workflow
Let’s creategraph.py, where we will define our LangGraph workflow. Here, we’ll define the steps (aka “nodes”) we want in the workflow, and the order of those steps.
Note, we have not implemented these nodes yet—we will do that next.
graph.py
- Six core nodes that perform different tasks
- A conditional edge that only processes diffs if changes are detected
- A logical flow from scraping to notifying
Step 4: Scrape gas prices with Browserbase
Let’s createnodes/scrape.py. This node will scrape HTML from our gas price website (this page from AAA) using Browserbase. Browserbase provides a managed browser that can navigate to the website and extract the table of gas prices.
nodes/scrape.py
current_html field in our state to the newly-extracted HTML.
Step 5: Transform HTML to CSV with LLM + Riza
Let’s createnodes/extract_price_data.py. This node will extract the data from our newly-scraped HTML, and transform it into a CSV. The CSV format is more compact and easier to manipulate for data analysis.
Why LLM + Riza
While we could handwrite code to extract and transform the data from the HTML, this code could break if the gas price website decides to rename the headers on their HTML table, or decides to change the HTML structure in some other way. To make this step more resilient to website design changes, we’ll scrape it by prompting an LLM to generate code to operate on the actual extracted HTML, and then run that code on Riza.Step 5a: Create a Riza custom runtime with beautifulsoup4 & plotly
Since we want the LLM to write code to extract data from HTML, let’s allow it to use beautifulsoup4, a popular Python library for parsing HTML. To make beautifulsoup4 available on Riza, we’ll create a custom runtime.
Later on (in Step 8), we’ll also want to run LLM-written code to generate a chart. So let’s also add plotly, a popular Python charting library, to our custom runtime.
Follow these steps:
- In the Riza dashboard, select Custom Runtimes.
- Click Create runtime.
- In the runtime creation form, provide the following values:
- Click Create runtime.
- Wait for the Status of your runtime revision to become “Succeeded”.
- Copy the ID of your runtime revision (not the runtime) and set it as the
RIZA_RUNTIME_REVISION_IDin the.envfile you created in Step 1.
Step 5b: Implement the node
Now let’s implement the logic that prompts an LLM to write code to transform the HTML to a CSV, and then runs that code on Riza. The code is below. Note how we:- Create a helper function,
_run_code(), that calls the Riza Execute Function API and uses our custom runtime. - Define a prompt that asks the LLM to generate code that can be run by the Riza Execute Function API.
- Pass the
current_htmlstored in our LangGraph state to both the LLM and to the Riza function call. - Update the LangGraph state to store the extracted CSV (under the field
current_csv).
nodes/extract_price_data.py
Step 6: Check if gas prices changed
Now, let’s createnodes/check_if_changed.py. This node will determine if the price data has changed. (Recall that in our LangGraph workflow, we specify that if the price data has not changed, the workflow should immediately end.)
Since this diffing logic is not the focus of our demo, we provide just a basic implementation that uses the built-in difflib Python library.
utils/diff.py
utils/storage.py
nodes/check_if_changed.py
Step 7: Summarize changes with LLM
Next, let’s createnodes/summarize_change.py. As we’ve specified in our LangGraph workflow, this node (and the following nodes) will only run if the previous step detected a change in gas prices. The Summarize Change node will prompt an LLM to act as a data analyst and highlight notable changes in the data.
In our demo, we’ll use a single LLM call to do this analysis, because the analysis for this data will be fairly simple. (For more complex data analyses, we’d likely want to turn this node into an agent that can write code and run the code on Riza, too.)
nodes/summarize_change.py
Step 8: Create relevant chart with LLM + Riza
Now, let’s createnodes/create_chart.py. This node will generate a chart that’s relevant to the analysis that the LLM produced in the previous step.
Why LLM + Riza
Since we don’t know what the analysis will be each time, we can’t implement this node with code that generates a pre-defined type of chart. Instead, we need to make a judgment call about the type of chart to generate, and then create that chart. This is a good example of a pattern that’s solved by using an LLM + Riza. We prompt the LLM to make the judgment call about what kind of chart to generate based on the analysis. We then ask the LLM to write code to generate that chart, and run that code on Riza.Implement the node
Now let’s implement the logic that prompts an LLM to write code to generate an appropriate chart, and then runs that code on Riza. To make it easier to write the code, let’s allow the LLM to useplotly, a popular Python charting library. Recall that in Step 5, we already created a Riza custom runtime that includes plotly. We’ll reuse that custom runtime here.
The code is below. Note how we:
- Create a helper function,
_run_code(), that calls the Riza Execute Function API and uses our custom runtime. - Define a prompt that asks the LLM to generate code that can be run by the Riza Execute Function API.
- Pass the
summary,previous_csv, andcurrent_csvstored in our LangGraph state to the LLM, and theprevious_csvandcurrent_csvto the Riza function call. - Save the chart image to a local file.
- Update the LangGraph state to store the location of the chart (under the field
chart_path).
nodes/create_chart.py
utils/storage.py:
utils/storage.py
Step 9: Store data and notify user
Let’s implement our last step:nodes/store_and_notify.py. This node will store the new CSV data (replacing the previous CSV data), and “notify” the user. Since this logic is not the focus of our demo, we provide just a basic implementation that saves the data to a local file, and prints the output to the console.
nodes/store_and_notify.py
Step 10: Create main.py
Finally, let’s create a main.py file that will kick off this workflow.
We import the LangGraph graph, and kick it off with the two pieces of state required at the start of the workflow: the URL of the gas price site, and the path to a local folder that you want to use to store the output files.
main.py
uv run main.py.
Summary: Benefits of Riza in AI agents
Integrating Riza’s code interpreter with LangGraph lets you build an AI agent that dynamically operates on the specific data it encounters. Here are the two concrete examples we saw in this demo.Resilient data extraction and transformation
Using Riza, we made our data extraction and transformation (Step 5) resilient to changes in the website’s HTML structure and header names. Instead of hardcoding the extract + transform logic, we dynamically generate and run code that does the extract + transform on the specific HTML the agent has just encountered.Create custom charts for dynamic reports
Using Riza, we made it possible to generate any appropriate chart to accompany a dynamic data analysis (Step 8). We built an agent that provides relevant insights, along with the most relevant visual chart, without having to resort to complex logic that maps different types of analyses to pre-defined chart types and chart-creation logic. Instead, without us having to write much code, the system can:- Analyze price data to identify trends
- Choose an appropriate visualization type (bar chart, map, etc.), and what data points to include (which may be a subset of the full data)
- Generate and execute custom code to produce the chart
Next steps
- Get the full code for this example in our GitHub.
- Try out the API.
- Learn how to use the Riza API with tool use APIs from OpenAI, Anthropic and Google.
- Check out the roadmap to see what we’re working on next.